Statistics and models
Statistics is the collection of data in the form of numbers. Scientists generally utilize data to characterize and summarize all of the data that has been collected in a n experiment; through this data, scientists can compare and contrast data from other experiments. Statistics uses a wide array of statistical tools to predict patterns and other things of the like.
Statistical populations are composed of individuals of the same make, but these individuals sometimes have different characteristics unique to them. A mean is the number obtained by adding up the data for a given set and dividing the sum by the number of individuals. The mean provides a single numerical measure for population.
Probability is the likelihood that a possible event will occur. Probability is usually expressed as a number between 0 and 1, and is written as a decimal rather than a fraction. However there must be a sample size large enough to produce accurate results.
Risk is the probability of an unwanted outcome. The most important risk we consider is the risk of death.
Models are patterns, plans, representations, or descriptions designed to show the structures or workings behind the objects. The are four types of models: Physical, Graphical, Conceptual, and Mathematical.
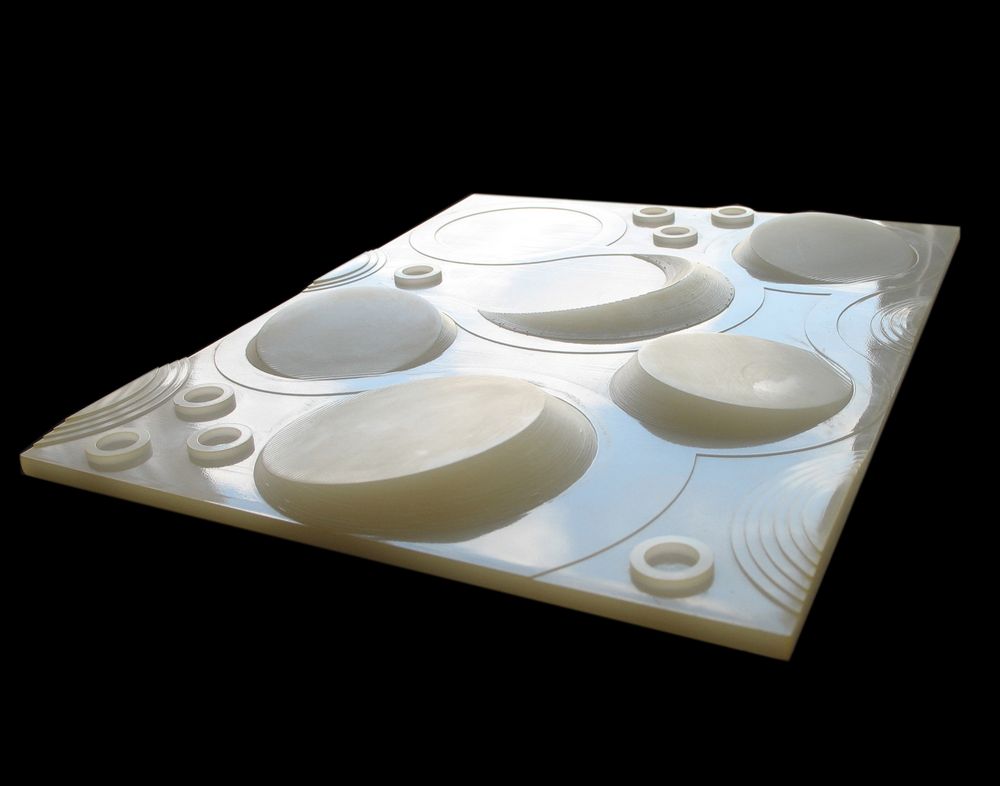
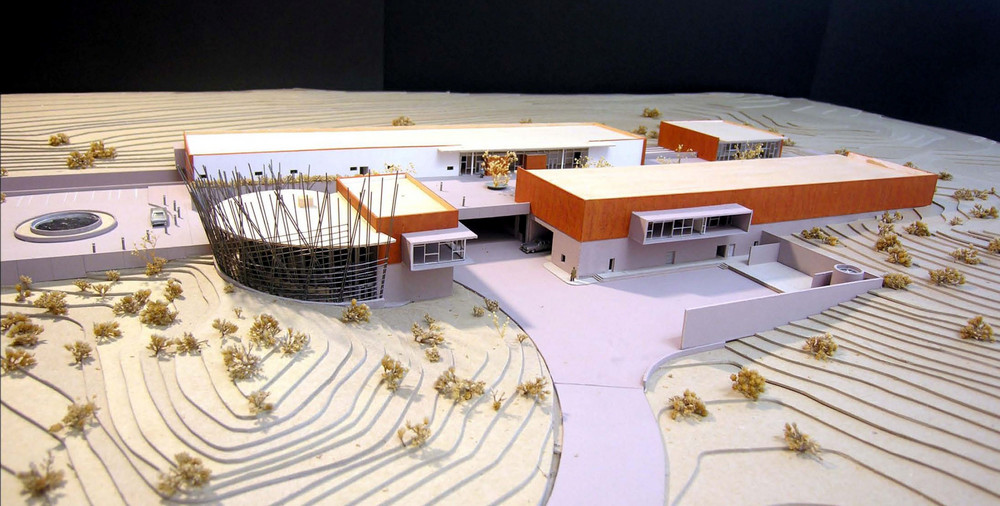
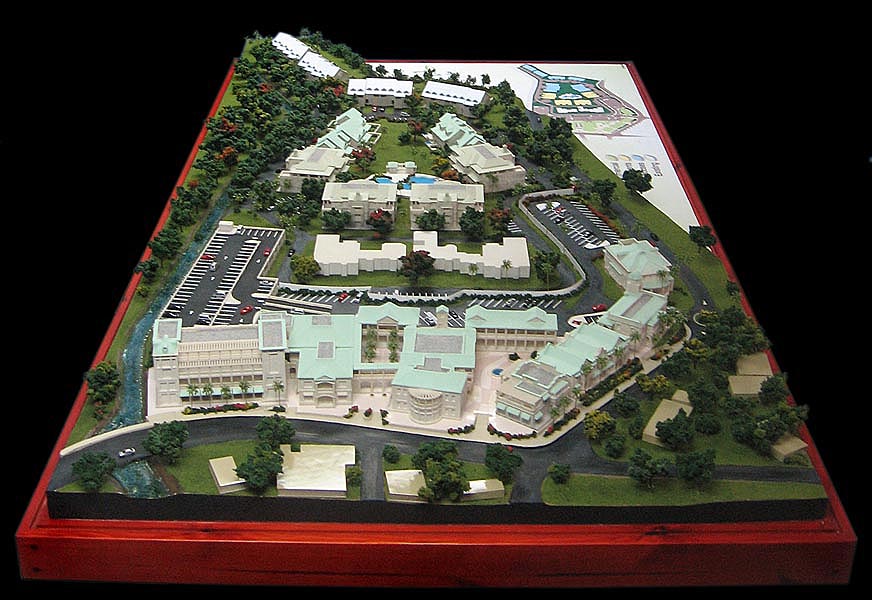
Physical are three dimensional objects that you can touch. They closely represent the system that they are modeled after. A good example of this would be the DNA helix.
Graphical are maps and charts. Scientists use these graphical models to show things such as the position of stars, or location.
Conceptual are verbal or graphical explanations of how a system works. A flow chart is a good example of a conceptual model, some can even be drawings.
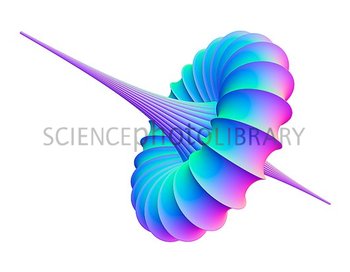
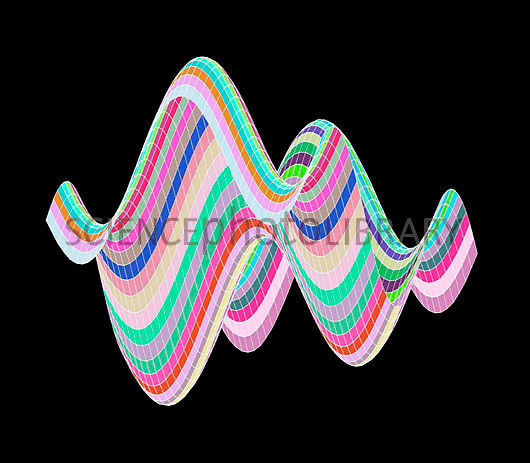
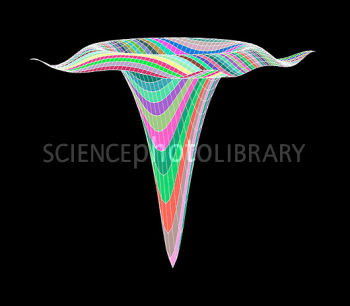
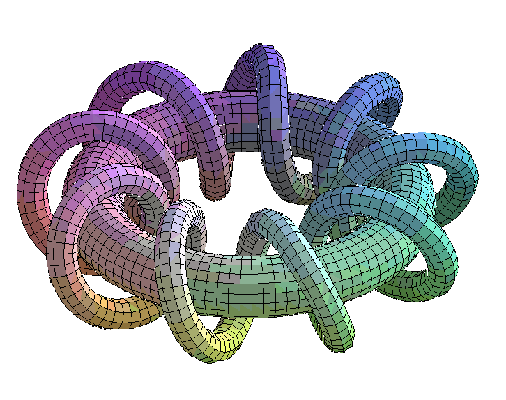
Mathematical models are one or more equations that represent the way a system works. useful with cases that have many variables, those in which an equation can be used to represent the model effectively. Although, if the data and equations are wrong.... the model will not be realistic and will provide incorrect information.
Statistical populations are composed of individuals of the same make, but these individuals sometimes have different characteristics unique to them. A mean is the number obtained by adding up the data for a given set and dividing the sum by the number of individuals. The mean provides a single numerical measure for population.
Probability is the likelihood that a possible event will occur. Probability is usually expressed as a number between 0 and 1, and is written as a decimal rather than a fraction. However there must be a sample size large enough to produce accurate results.
Risk is the probability of an unwanted outcome. The most important risk we consider is the risk of death.
Models are patterns, plans, representations, or descriptions designed to show the structures or workings behind the objects. The are four types of models: Physical, Graphical, Conceptual, and Mathematical.
Physical are three dimensional objects that you can touch. They closely represent the system that they are modeled after. A good example of this would be the DNA helix.
Graphical are maps and charts. Scientists use these graphical models to show things such as the position of stars, or location.
Conceptual are verbal or graphical explanations of how a system works. A flow chart is a good example of a conceptual model, some can even be drawings.
Mathematical models are one or more equations that represent the way a system works. useful with cases that have many variables, those in which an equation can be used to represent the model effectively. Although, if the data and equations are wrong.... the model will not be realistic and will provide incorrect information.